Choosing a school
Secondary school results explained: a parent’s guide to comparing schools
You come home from a school open evening with a prospectus full of impressive numbers. One school celebrates its top GCSE grades. Another highlights its Attainment 8 score. A third quotes a positive Progress 8 figure.
Then comes the question that matters: what do these results actually tell me about the school my child might attend?
Start by checking what each number measures, which children or exam entries it includes, and the year it comes from. A percentage without those details is difficult to judge—and two impressive-looking percentages may describe completely different things.
This guide explains the language, shows how to compare results fairly, and gives you questions to take to your next school visit.
Start here: three changes and distinctions to know
For England’s 2025–26 school-performance reporting, Attainment 8 and the percentage achieving grade 5 or above in English and maths remain headline academic measures. Progress 8 cannot be calculated for 2025 or 2026 because the relevant primary assessments were cancelled during the pandemic. Older scores may still appear. EBacc entry and attainment measures have been removed from 2025–26 reporting. [1]
That means a school’s results page can contain a mixture of current attainment figures and historical terminology. Always read the dates.
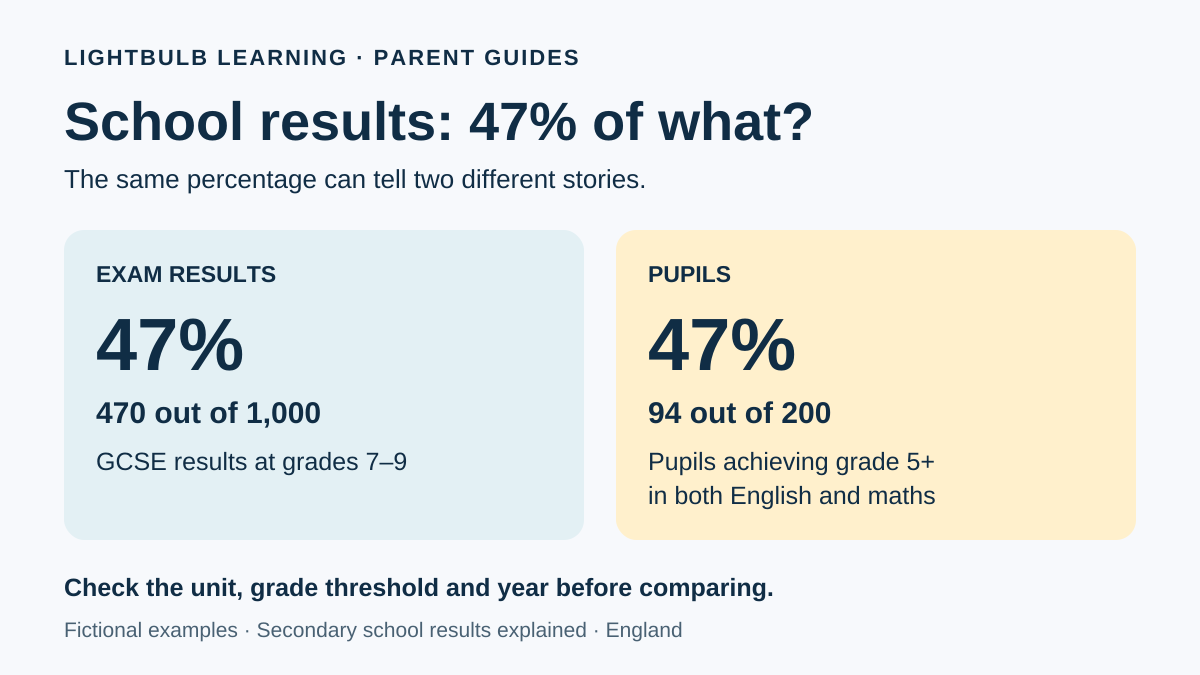
“47% achieved high grades”—47% of what?
Imagine seeing this headline:
47% of GCSE grades were 7–9.
It describes exam results, not necessarily the proportion of children achieving those grades.
In a fictional school with 1,000 GCSE results, 470 at grades 7–9 would produce that headline:
470 ÷ 1,000 × 100 = 47%.
It does not tell you how those high grades were distributed. Some pupils might have achieved several; others might have achieved none.
Now consider a different statement:
47% of pupils achieved grade 5 or above in both English and maths.
Here the unit being counted is pupils, and the condition concerns both subjects. In a fictional cohort of 200 pupils, that would mean 94 pupils met the condition:
94 ÷ 200 × 100 = 47%.
The percentages are identical. Their meanings are not.
Before comparing a headline, ask:
- Is this a percentage of pupils, qualifications or exam entries?
- Does it cover all subjects, selected subjects, or English and maths together?
- Is the threshold grade 4, 5, 6, 7 or 9?
- Which results year and year group does it describe?
If a school advertises “47% grade 6 and above”, you cannot decide whether that is strong until you know the answers.
GCSE grades explained: what happened to A*–A?
GCSEs in England use grades 9 to 1, with 9 highest. The old letter grades and current numbers do not have a perfect one-to-one conversion. Ofqual identifies two useful comparison points: the bottom of grade 7 aligns with the bottom of the old A, and the bottom of grade 4 with the bottom of the old C. [2]
So a school’s “grades 9–7” headline concerns high attainment, but it should not be treated as an exact conversion of every historical A*–A result.
| Wording on a results page | What to check |
|---|---|
| Grades 9–7 | The share reaching grade 7 or higher; check whether this counts entries or pupils |
| Grades 9–4 | A wider grade range than 9–7; do not compare the two as if they use the same threshold |
| Grade 5+ in English and maths | Pupils meeting the threshold in both subjects |
| A*–A | The qualification and year: this could describe A levels or older GCSE results |
Are GCSE grade percentages fixed?
No universal rule says that a particular percentage of marks always earns a particular GCSE grade. Grade boundaries are set for each exam series, taking account of paper difficulty. [2]
Keep these two questions separate:
- “What percentage of this school’s results were grade 7 or above?” describes the school’s outcomes.
- “What percentage of marks earns a grade 7?” asks about an examination’s grade boundary.
For the second question, use the relevant exam board’s boundaries for the correct qualification, tier and year. Our GCSE grade boundaries guide explains how to read them.
What is Attainment 8?
Attainment 8 summarises achievement across eight qualifying slots. Maths counts twice; English counts twice when both English language and literature are taken. Three slots draw from specified academic subjects and three are open to eligible qualifications. It is not simply any pupil’s eight highest grades. [1]
A simple worked example
Suppose a fictional pupil has the following eligible GCSE grades, correctly allocated to the slots. Both English qualifications were taken, and the higher English grade is used in the English slot.
| Slot | Grade | Points in this example |
|---|---|---|
| English | 6 | 12 |
| Maths | 5 | 10 |
| Academic slot 1 | 6 | 6 |
| Academic slot 2 | 5 | 5 |
| Academic slot 3 | 5 | 5 |
| Open slot 1 | 6 | 6 |
| Open slot 2 | 5 | 5 |
| Open slot 3 | 4 | 4 |
| Total | 53 |
The arithmetic is 12 + 10 + 6 + 5 + 5 + 6 + 5 + 4 = 53.
There are ten weighted units in this example. Dividing 53 by 10 gives 5.3, which helps you interpret the scale. It does not mean every subject received a grade of 5.3, or that 53 is a percentage.
What is a good Attainment 8 score?
Avoid choosing a school using a universal cut-off invented by a guide or league table. Instead, compare its score with the published England benchmark for the same year and population, then look at the school’s intake and other outcomes.
A score of 60 is higher attainment on this measure than 50. It does not, by itself, establish that the first school teaches more effectively or would be the better choice for your child.
When looking up an average Attainment 8 score, check whether the comparison covers state-funded schools or another population. Do not mix a recent school result with an old national average. Our guide to GCSE attainment gaps by area explains why regional and local-authority averages also need careful interpretation.
What is Progress 8, and what does its score mean?
Historically, Progress 8 compared outcomes with pupils nationally who had similar primary-school attainment. Zero indicated performance in line with that comparison group; positive and negative scores indicated outcomes above and below it. It is not a percentage. [1]
That helps distinguish two parent questions:
Attainment: “How high were the results?”
Progress: “How did the results compare with those of pupils who started at a similar point?”
What is a good Progress 8 score?
A positive score is a favourable signal, but read the published uncertainty range and accompanying description before ranking schools with close scores. Ask whether differences are meaningful, rather than treating every decimal place as a decisive verdict.
For example, +0.24 and +0.28 should prompt a closer look at the supporting information, not an automatic conclusion that the second school is better.
Most importantly, label historical results. A strong score from an earlier cohort is useful background; it is not a measurement of the 2026 cohort or a promise about your child’s future.
What is EBacc—and is it still used?
EBacc means English Baccalaureate. Historically it described a GCSE subject combination covering English language and literature, maths, sciences, history or geography, and an ancient or modern foreign language. It was a school-performance measure, not an extra qualification awarded to pupils. [3]
Older results pages may show EBacc entry, describing participation in the subject combination, or an EBacc average point score, describing attainment. Participation and attainment answer different questions.
As noted above, the government removed EBacc entry and attainment measures from 2025–26 reporting. Older pages explaining them should be read as historical material. The removal does not mean that individual GCSEs in those subjects have disappeared. [1]
For a school visit, the more useful question is: “Which subjects will my child be able to study, and how will you help them choose?”
How to compare two schools without being misled
The following schools and figures are fictional. They are not an assessment of any real school.
| Measure | School A | School B |
|---|---|---|
| Share of GCSE entries at grades 9–7, same year | 47% | 34% |
| Pupils achieving grade 5+ in both English and maths, same year | 68% | 75% |
| Attainment 8, same year | 58 | 55 |
| Intake information | Academically selective | Non-selective |
School A has the higher share of top grades and the higher Attainment 8 score. School B has a higher proportion meeting the English-and-maths threshold.
Neither statement cancels the other. They reveal different strengths in the published outcomes. The admissions difference also matters: these are not equivalent starting groups.
Your next questions might be:
- “How do you support pupils who are just below the English or maths threshold?”
- “What opportunities are available for pupils already working confidently?”
- “Are the subject results and entry policies consistent with my child’s interests?”
The Department for Education advises considering multiple measures and school context, rather than relying on attainment alone. [4]
Look at several years—but keep the measures comparable
A single cohort can be unusual. Small groups are especially sensitive to individual results. [4]
For example, in a fictional group of 25 pupils, one pupil represents four percentage points. In a group of 200, one pupil represents half a percentage point. A movement in a headline percentage is easier to interpret when you know the group size.
Check that the threshold, qualifications and reporting rules have stayed comparable before describing a trend. Ask the school to explain changes in either direction.
Does a high pass rate make a good school?
Strong results deserve attention. They are evidence about what a particular cohort achieved under particular conditions. They cannot tell you everything about how your child will experience the school.
Even if your starting point is purely academic, look beyond the highest grades. You want to understand subject choice, support for gaps in knowledge, challenge for confident learners, and what happens when a pupil struggles.
For a child entering Year 7, today’s GCSE results describe older pupils. Use them to ask better questions about the teaching your child will receive over the next five years. See what children learn in Year 7 for questions about the first stage of that journey.
Your school-results checklist
Before you decide that one school has “better results”, check:
- Year: are you comparing the same results year?
- Stage: are both figures GCSE results, rather than mixing GCSE and A level?
- Unit: pupils or exam entries?
- Threshold: the same grades and subjects?
- Coverage: the whole cohort or a selected group?
- Context: what does the admissions policy tell you about the intake?
- History: what do comparable earlier years show?
- Your child: what academic support and challenge would actually be available?
A useful opening question at an open evening is: “Could you talk me through these results and explain which figures would be most relevant to a child starting at my child’s current level?”
From understanding results to supporting learning
Once you have understood a school’s numbers, bring the conversation back to your child: which topics feel secure, where are the gaps, and what would help them feel more confident?
If top grades are part of that conversation, our guide to how rare a Grade 9 GCSE is explores the question in more detail. You can also explore Lightbulb Learning for support with KS3 and GCSE learning.
Sources
- Department for Education, Secondary accountability measures: 2026 guidance. Current reporting changes, Attainment 8 and historical Progress 8 methodology.
- Ofqual, GCSE 9 to 1 grade scale explained. Grade comparisons and boundaries.
- Department for Education, withdrawn English Baccalaureate guidance. Used only for the historical meaning and subject combination; superseded on current reporting by source 1.
- Department for Education, Understanding school and college performance measures. General comparison principles; its older headline-measure list is not used as current policy.
Common questions
Is an Attainment 8 score of 50 the same as a 50% pass rate?
No. One is a points-based measure; the other is a percentage meeting a specified condition. Read the label before comparing them.
Why does a school show an older Progress 8 score?
There is no new Progress 8 measure for the 2025 or 2026 cohorts. Check the date attached to any score rather than assuming it describes the latest results.
Are grades 9–7 exactly the same as A*–A?
No exact grade-by-grade conversion exists. The bottom of grade 7 is comparable to the old A threshold, but use the original scale and reporting year when comparing results.
Should I choose the school with the most grade 9s?
Use that as one piece of information. Ask how widely high attainment is shared and how the school supports pupils across the attainment range. A headline cannot predict your own child’s outcome.
Where can I find official school results?
Use the Department for Education’s “Find and compare schools and colleges in England” service (https://www.gov.uk/find-compare-schools-colleges), checking the year and definitions alongside each measure. The older “Compare school and college performance” service is closing and is not updated beyond 2024/25 results. Compare the official figures with the school’s own explanation and ask about any apparent differences.
Turn tonight’s topic into a real revision session.
Lightbulb builds notes, flashcards, a quiz and a marked exam question from whatever your child covered in class today — matched to their exam board. When full access opens, your first 3 sessions will be free.
Join the waitlist →